Schedule Chart
Gantt Schedule Chart focuses on the activity sequence and timing for various components
of a job. It can also be used to monitor the actual progress of a job in relation to the
plan.
A bar is used to represent subtasks within the
total job.The location of each bar indicates the time at which each subtask is scheduled
to be performed.Normally, the planned production hours indicated at the top of the bar.The
chart can be marked to indicate actual progress of the job. The chart gives a graphic
overview of the job's status, suggesting where corrective action may be desired. One
example of Gantt Schedule Chart is shown below:
Figure6
Example of the Gantt Schedule Chart:
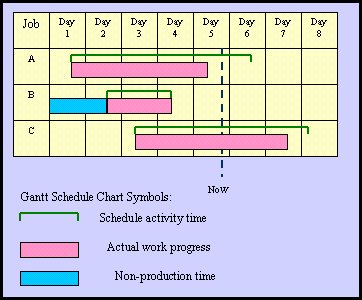
The Gantt Schedule Chart symbols indicated as below :
 Each of the green brackets on the time
axis denotes the estimated starting and finishing
of
a job enclosed within it.
Each of the green brackets on the time
axis denotes the estimated starting and finishing
of
a job enclosed within it.
The red
solid bars reflect the actual progress of the job.
The blue
solid bar indicates the non-production time or maintenance time.
The blue dotted line indicates that the
current date. Therefore, the progress of the
schedule can be checked out
whether it is ahead of schedule, on schedule or behind
schedule.
The results of the observation from the example of Gantt Schedule Chart above are:
1. Job A is about one-half
day behind the schedule.
2. Job B was completed after
equipment maintenance, it is on schedule.
3. Job C is ahead of
schedule.
 Job Sequencing
 Back to
Top
Back to
Top

[Gantt Chart]
[Load chart] [Schedule
Chart]


.gif)
