Load Chart

Load Chart

Home Up


Help


Back to Gantt Chart

Table of Content

Forward to Gantt Schedule Chart

Load Chart

        Load Chart depicts the loading and idle times of a group of machines or a list of departments.

            Figure5    This is an example of Gantt Load Chart:                       

                    loadchart.jpg (35177 bytes)                      
               
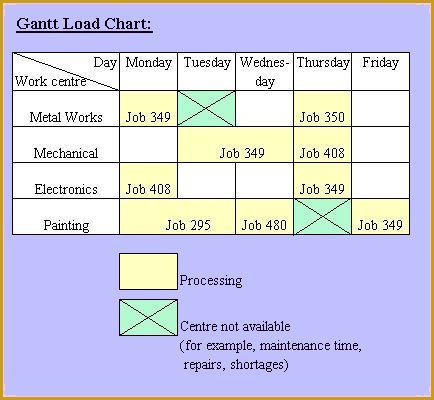
A typical load chart is illustrated in figure above. This chart indicateds that:
                    1.     Painting work centre is completely loaded for the entire week
                    2.     Metal Works, Meachanical and Electronics work centres will be available on
                            Friday.
                    3.     The white colour box indicates that the work centre will be available.
                    4.     The yellow coloue box indicates that the work centre is working on certain job,
                            for example, painting work centre is working on the job349 on Tuesday and
                            Wednesday.
                    5.     The green box indicates that the centre is not available because is busy doing
                            other work, for example, maintenance job, repairs job or shortages.

            Gantt Load Chart have some major limitations:

For one, it does not account for production availability such as unexpected breakdowns or human error that require reworking a job..

The chart must also be updated regularly for account for new jobs and revise time estimates.

Schedule Chart   Schedule Chart

Back to top   Back to Top

[Gantt Chart]    [Load Chart]    [Schedule Chart]